IC Markets Home Sign in Web Trader Contáctanos
IC Markets Social IC Markets Social

Información para
Operadores Serios

  • Acerca de IC Markets
  • ABRA UNA CUENTA BURSÁTIL
  • PRUEBE UNA DEMO GRATIS
  • Comienza a Operar
  • VISIT OUR BLOG
IC Markets Social
  • Acerca de IC Markets
  • ABRA UNA CUENTA BURSÁTIL
  • PRUEBE UNA DEMO GRATIS
  • Comienza a Operar
  • VISIT OUR BLOG
July 22, 2022North_American_Stocks_enIC Markets

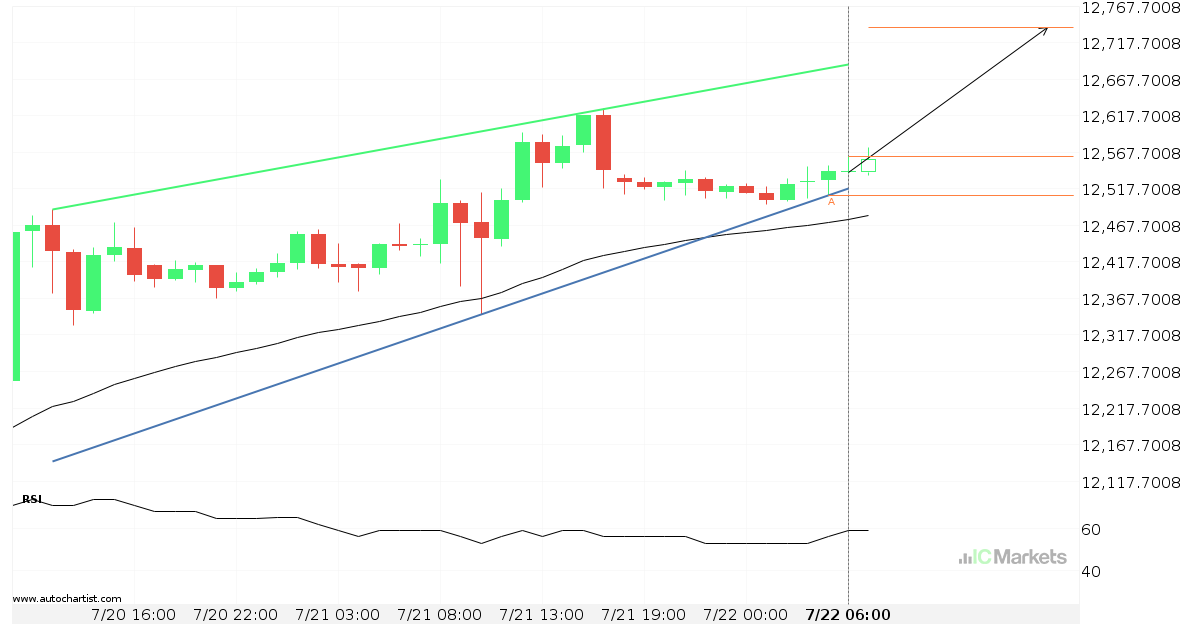
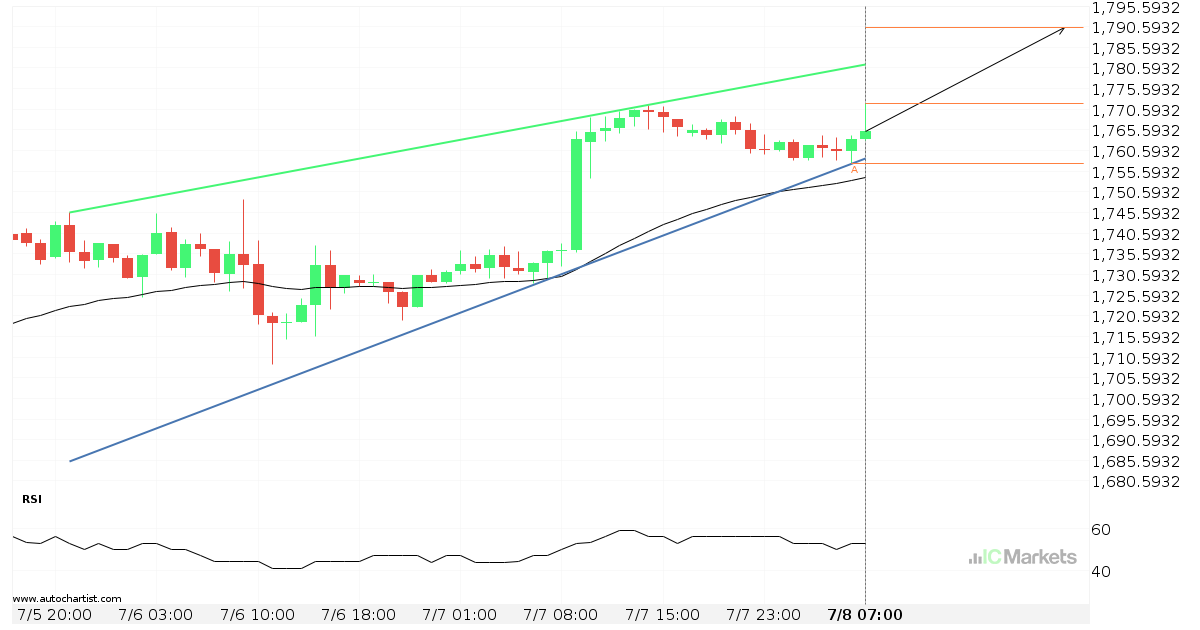
US Tech 100 Index approaching resistance of a Rising Wedge

US Tech 100 Index is approaching the resistance line of a Rising Wedge. It has touched this line numerous times in the last 2 days. If it tests this line again, it should do so in the next 11 hours.

Read more
July 21, 2022North_American_Stocks_enIC Markets

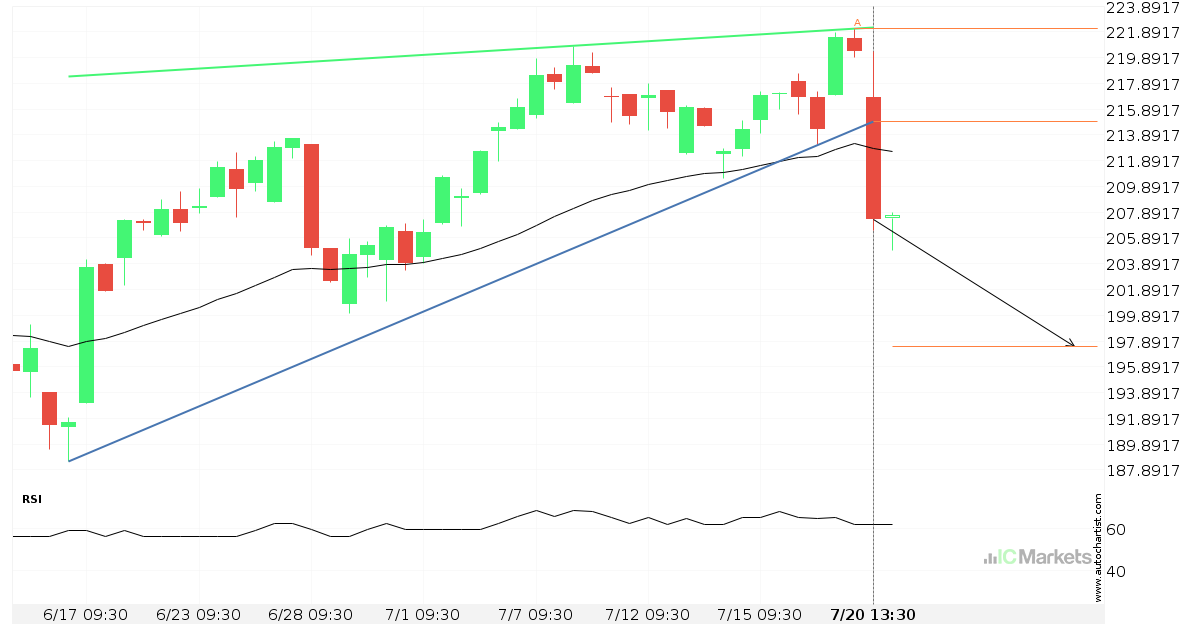
Possibility of big movement expected on Biogen Idec Inc

Biogen Idec Inc has broken through a support line of a Rising Wedge and suggests a possible movement to 197.5032 within the next 3 days. It has tested this line in the past, so one should probably wait for a confirmation of this breakout before taking action. If the breakout doesn’t confirm, we could see […]

Read more
July 20, 2022North_American_Stocks_enIC Markets

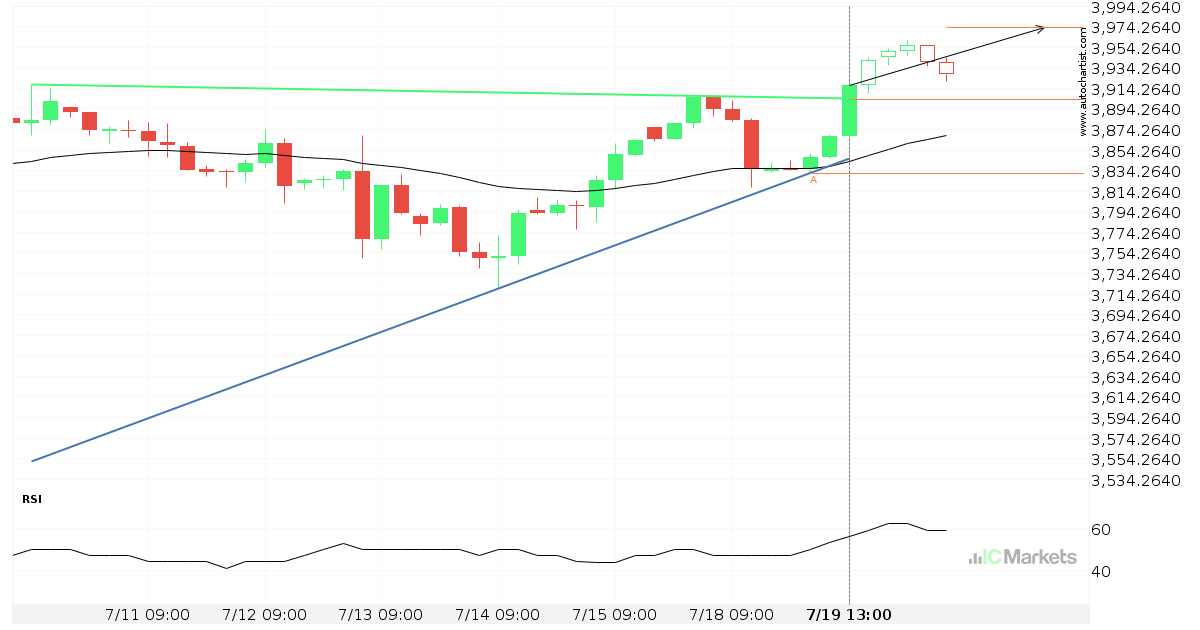
US SPX 500 Index has broken through resistance

US SPX 500 Index has broken through a resistance line. It has touched this line at least twice in the last 12 days. This breakout may indicate a potential move to 3973.1848 within the next 2 days. Because we have seen it retrace from this position in the past, one should wait for confirmation of […]

Read more
July 19, 2022North_American_Stocks_enIC Markets

US Wall Street 30 Index approaching resistance of a Rising Wedge

US Wall Street 30 Index is approaching the resistance line of a Rising Wedge. It has touched this line numerous times in the last 7 days. If it tests this line again, it should do so in the next 2 days.

Read more
July 18, 2022North_American_Stocks_enIC Markets

US SPX 500 Index – psychological price line breached

US SPX 500 Index has broken through a resistance line. Because we have seen it retrace from this price in the past, one should wait for confirmation of the breakout before trading. It has touched this line numerous times in the last 12 days and suggests a possible target level to be around 3911.4299 within […]

Read more
July 15, 2022North_American_Stocks_enIC Markets

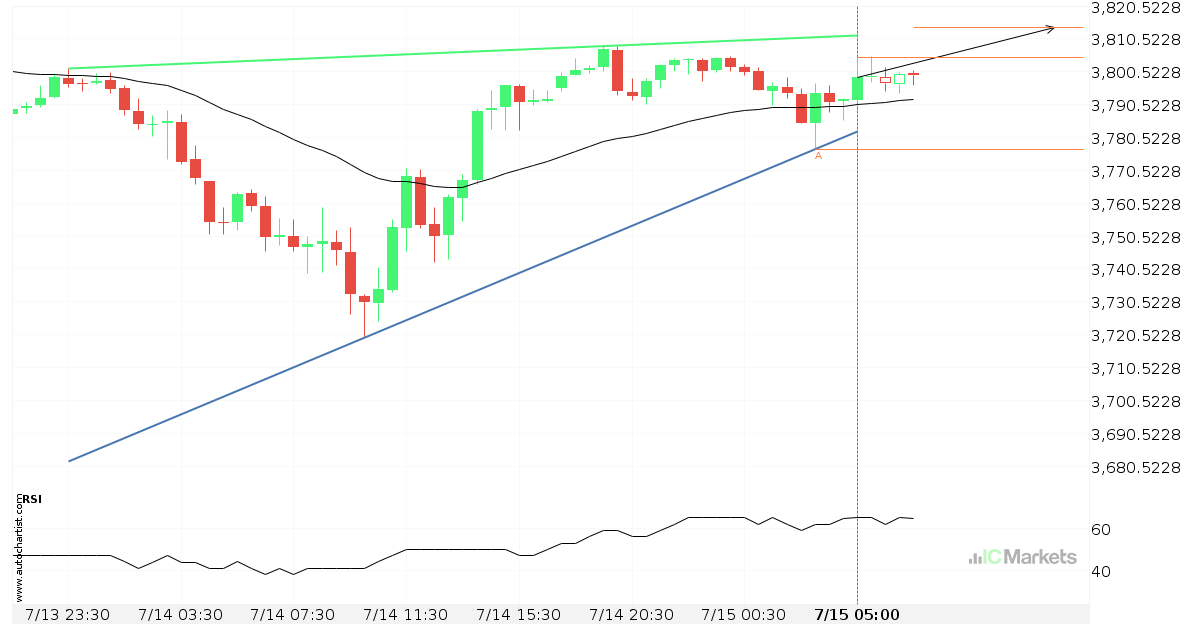
US SPX 500 Index approaching resistance of a Rising Wedge

US SPX 500 Index is approaching the resistance line of a Rising Wedge. It has touched this line numerous times in the last 2 days. If it tests this line again, it should do so in the next 7 hours.

Read more
July 13, 2022North_American_Stocks_enIC Markets

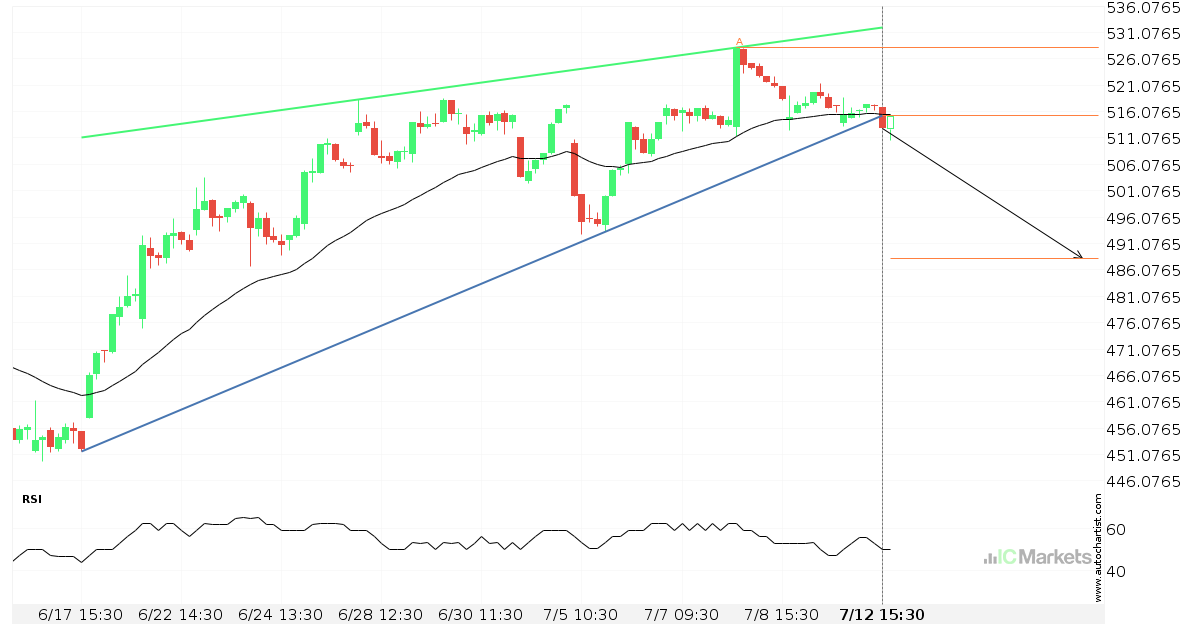
Support line breached by Unitedhealth Group Inc.

Unitedhealth Group Inc. has broken through the support line which it has tested twice in the past. We have seen it retrace from this line before, so one should wait for confirmation of the breakout before trading. If this new trend persists, a target level of around 488.3110 may materialize within the next 2 days.

Read more
July 12, 2022North_American_Stocks_enIC Markets

Possible breach of support level by US Small Cap 2000 Index

US Small Cap 2000 Index is moving towards a support line which it has tested numerous times in the past. We have seen it retrace from this line before, so at this stage it isn’t clear whether it will breach this line or rebound as it did before. If US Small Cap 2000 Index continues […]

Read more
July 8, 2022North_American_Stocks_enIC Markets

Possible breach of resistance level by US Small Cap 2000 Index

US Small Cap 2000 Index is moving towards a resistance line which it has tested numerous times in the past. We have seen it retrace from this line before, so at this stage it isn’t clear whether it will breach this line or rebound as it did before. If US Small Cap 2000 Index continues […]

Read more
July 7, 2022North_American_Stocks_enIC Markets

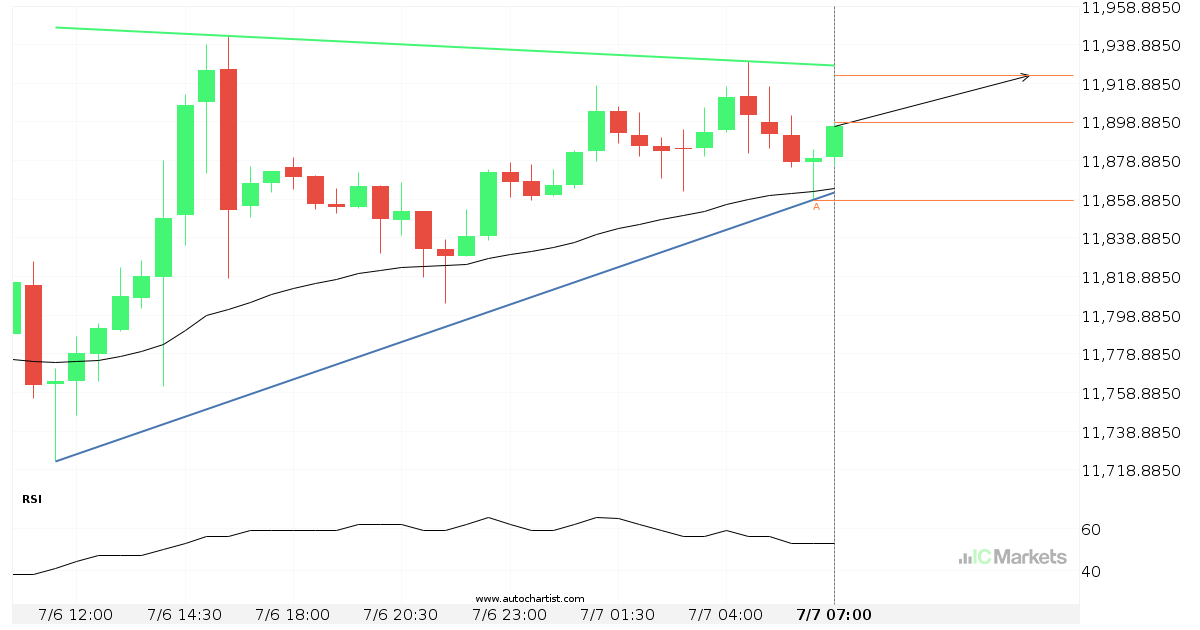
US Tech 100 Index approaching resistance of a Ascending Triangle

US Tech 100 Index is approaching the resistance line of a Ascending Triangle. It has touched this line numerous times in the last 19 hours. If it tests this line again, it should do so in the next 5 hours.

Read more
  • 1
  • 2
  • 3
  • …
  • 7
  • 8
  • 9
  • 10
  • 11
  • 12
  • 13
  • …
  • 45
  • 46
  • 47

Recent Posts

  • Either a rebound or a breakout imminent on SILVER
  • GOLD Nível visado: 2976.3601
  • A potential bearish movement on GOLD
  • มีโอกาสเกิดการเคลื่อนตัวแบบ bearish บน GOLD
  • Posible gran movimiento en el AUDJPY

Recent Comments

    Traducción


     Edit Translation

    Opere con un

    líder del mercado en el que puede confiar

    ABRA UNA CUENTA BURSÁTIL PRUEBE UNA DEMO GRATIS

    Trading en Forex

    • Qué es Raw Spread
    • Resumen de cuentas
    • Abre una Cuenta
    • Trader Launch en Web

    Especificaciones de Trading

    • Spreads y Comisiones
    • Rango de Mercados
    • Horas de Trading
    • Depósitos
    • Retiros

    Acerca de IC Markets

    • Help Center
    • Por qué con IC Markets
    • Regulación
    • Documentos Legales
    • Contáctanos


    Forex Trading

    • Accounts Overview
    • Open an Account
    • Launch Web Trader

    Trading Specifications

    • Spreads and Commissions
    • Range of Market
    • Trading Hours
    • Funding
    • Withdrawal

    About IC Markets

    • Chat with a Specialist 24/7
    • Why IC Markets
    • Regulation
    • Legal Documents
    • Contáctanos

    Descargo de responsabilidad: Estos documentos son material de marketing cuyo contenido es publicado solo con propósitos informativos. Este material no contiene y no debe ser considerado un consejo de inversión y recomendaciones, o sugerencias para llevar a cabo otras acciones con los instrumentos financieros. Los widgets integrados pertenecen a sus autores independientes externo, y IC Markets no es responsable de su contenido o cómo afectan en las operaciones.

    Derechos reservados de todo el contenido. Las opiniones de los autores tal vez no coincidan con la opinión de los editores del blog. Cuando copie material de este sitio o conecte RSS para volver a publicar nuestros artículos, es obligatorio el enlace a IC Markets o la atribución en el formato “Blog de IC Market”. Para dudas generales, por favor, póngase en contacto con la oficina editorial a través de la página “Contacto”.

    Advertencia de riesgo: Operar derivados conlleva un altor riesgo en su capital y solo debería operar con capital que puede permitirse perder. Las operaciones con derivados podrían no ser adecuadas para todos los inversores, por lo tanto, asegúrese de entender por completo los riesgos que conlleva y buscar asesoramiento independiente si fuera necesario. Una Declaración de Divulgación del Producto (PDS, por sus siglas en inglés) se tendrá en cuenta antes de participar en una transacción con nosotros.

    Los contenidos de esta página son solo información general y no tienen en cuenta su situación personal, objetivos financieros o necesidades. Depende de usted garantizar que los productos que ofrecemos se ajustas a sus necesidades específicas. No debería operar con nosotros a menos que entienda las características y riesgos de los productos que ofrecemos. Esto significa que tal vez necesite buscar asesoramiento independiente antes de empezar a operar con nosotros.

    © 2022 Raw Trading Ltd | All rights reserved.
    • Sample Page